A no-code workflow that turns raw sales into a daily executive briefing
If you've ever started your day with an email titled "Daily Sales Report (WIP)", you already know the pain. The report's late, someone's fighting CSVs, and your leadership call turns into a group therapy session about version control.
Meanwhile, the highest-paid people in the company are itemizing spreadsheet crimes and calling it "alignment."
This is a story about a team that decided enough was enough, and built a reliable, fully automated daily revenue briefing in a single afternoon. No engineers. No vendor heroics. No brand names necessary.
The Morning Ritual (and Why It Hurt)
Here's what their mornings used to look like:
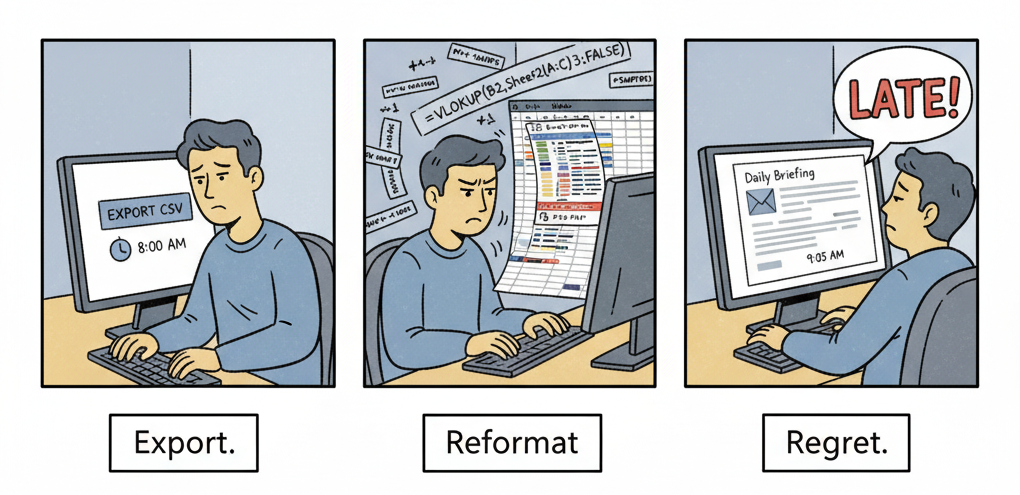
- 8:00 AM → Manual export from the sales system.
- 8:20 AM → Spreadsheet kung fu.
- 8:45 AM → Copy-paste charts into a deck.
- 9:05 AM → "Good enough" email to leadership.
- 12:00 PM → A follow-up thread titled "We'll fix it later."
It wasn't a process. It was a performance; one that burned hours but still delivered data that everyone doubted.
What They Built Instead
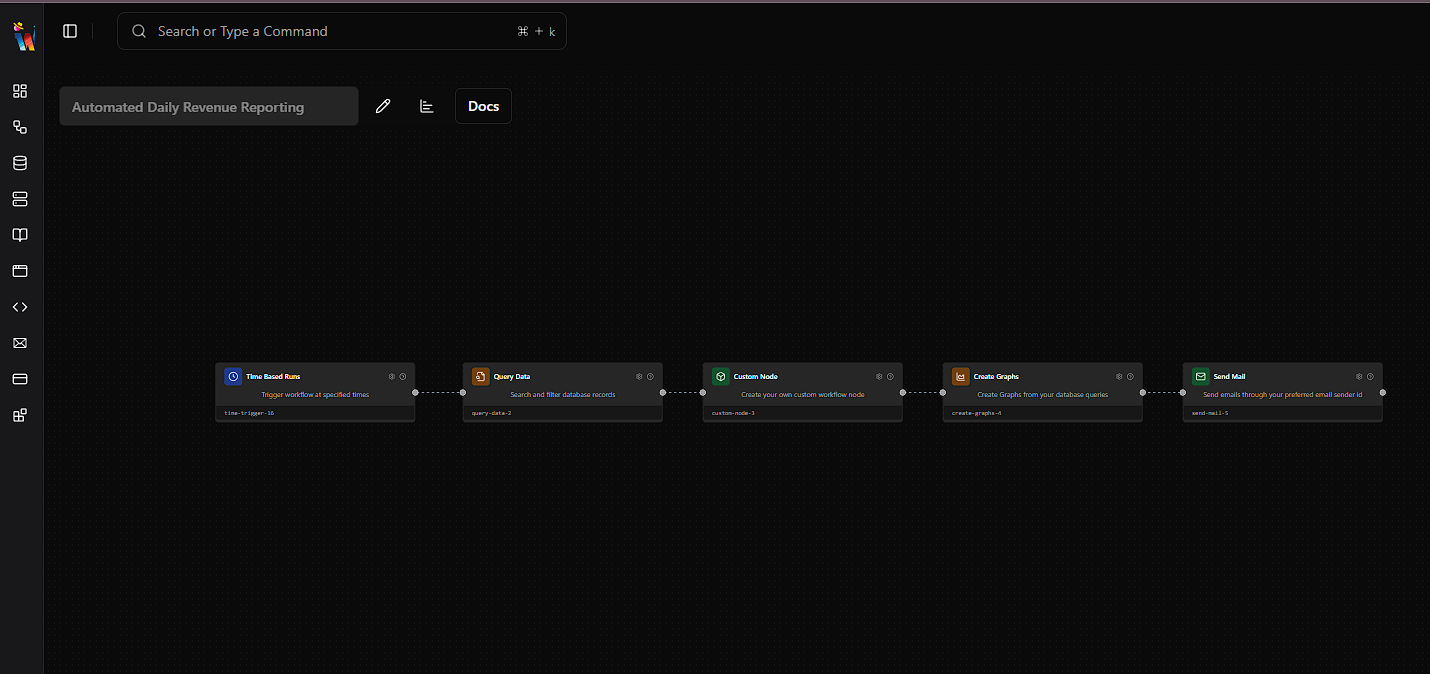
The fix wasn't a massive rebuild. It was a simple, modular five-node workflow inside WorqHat that did the job perfectly: pull the latest data, analyze it, visualize it, and ship the report on time. Every time.
1. Time-Based Runs
The workflow wakes up at 9:00 AM sharp, daily. No reminders, no "who's on report duty?" Slack threads. It just runs.
2. Query Data
It connects directly to the sales database and pulls yesterday's transactions. No file downloads, no VLOOKUP drama, no "which version?" whisper-fights. One query. One truth.
3. Text Gen (Detailed Analysis)
Here's where it gets fun. Instead of crunching numbers in a spreadsheet, the Text Gen node acts like an embedded analyst. It ingests the raw rows and produces both a readable summary and a structured JSON of metrics.
It captures:
- Total revenue and transaction count
- Average order value (AOV) and conversion rate
- Product/category breakdowns, winners, laggards, anomalies
- Trend commentary (spikes, dips, or steady state)
- Refund and error patterns
- Actionable notes ("Promo B is underperforming," "Category C margin dip detected")
The output looks something like this:
- A tight executive summary (for humans)
- A clean JSON block (for charts)
You get analysis and structure, no double work, no retyping numbers.
4. Create Graphs
Using the structured metrics from Text Gen, Create Graphs renders:
- Revenue by product/category (bar chart)
- Day-over-day revenue trend (line chart)
- Conversion vs. AOV (dual-axis chart)
- Refunds vs. net revenue (stacked bar)
Charts generate server-side, attach automatically, and show up inline in the email. It feels like a real briefing, not a treasure hunt of links.
5. Send Mail
At exactly 9:00 AM, every leadership inbox gets:
Subject: Daily Revenue Briefing
- Executive Summary (1–2 paragraphs)
- KPI Table (Revenue, Transactions, AOV, Conversion, Refunds)
- Inline charts
- "Actions Today", two or three smart nudges for focus
No CC chains. No "please update this cell." Just signal.
Why This Works (and Keeps Working)
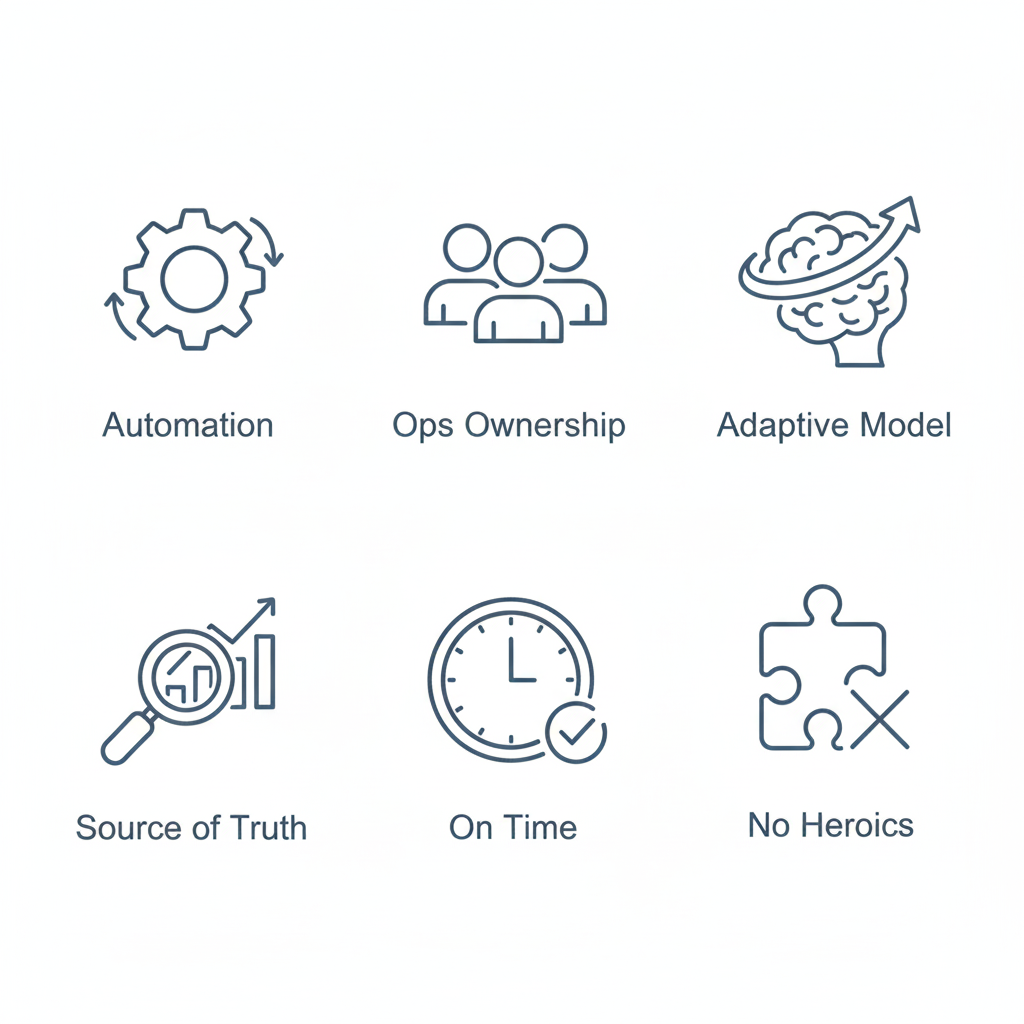
- Ops owns it. No-code means updates happen without Jira tickets.
- Text Gen beats scripting. The model adapts its tone and logic as data patterns change, but keeps structured metrics consistent for graphs.
- Single source of truth. Direct queries, zero CSV roulette.
- Zero heroics. It runs whether or not someone remembered the coffee.
The Results
- 10+ hours/week saved for the ops team. They now analyze insights instead of formatting cells.
- Decisions before coffee. The briefing lands at 9:00 AM sharp; standups start with facts.
- Trust in numbers. Every chart, KPI, and sentence ties back to the same query.
- Fewer surprises. Micro-insights every morning prevent macro-crises every month.
What the Daily Email Looks Like
Subject: Daily Revenue Briefing — {Yesterdays Date}
Executive Summary: Yesterday's revenue increased 7.8% day-over-day, driven by Category A (+12.3%) with strong performance from Product A1. Transactions rose 5.1%, lifting AOV by 2.6%. Refunds stable at 1.1%. Notable: a mid-day surge between 12–2 PM, late-evening conversions dipped 3.4%. Actions: extend mid-day promo, retarget the evening slot.
KPIs:
- Revenue: $248,930 (+7.8% DoD)
- Transactions: 4,982 (+5.1%)
- AOV: $49.97 (+2.6%)
- Conversion: 3.4% (–0.1 pp)
- Refunds: $2,791 (1.1%)
Charts:
- Revenue by Category (Bar)
- Day-over-Day Revenue (Line)
- Conversion vs. AOV (Dual Axis)
- Refunds vs. Net Revenue (Stacked Bar)
Actions Today:
- Extend Category A promo window to 3 PM.
- Investigate evening drop, test free shipping banner 8–11 PM.
- Review discount leakage in Category C.
Under the Hood (For the Curious 🐱)
Workflow:
- Time Based Runs: Trigger 9:00 AM daily.
- Query Data: Pull yesterday's transactions.
- Text Gen (Detailed Analysis): Convert raw rows to summary + JSON.
- Create Graphs: Render visualizations from JSON metrics.
- Send Mail: Ship the finished briefing.
Bonus:
- Charts use structured data, not text, visuals never drift.
- Anomalies get flagged automatically with contextual notes.
- All nodes are editable, anyone on the team can tweak KPIs or email format.
Accuracy Without Anxiety
The Text Gen node doesn't "replace math." It works on top of ground-truth data, validating totals and highlighting inconsistencies before they reach your inbox.
The JSON output drives the charts, so numbers in prose and visuals always match. That's how you keep credibility while staying fully automated.
The Outcome (and the Habit It Created)
A few weeks after launch, the team stopped thinking of "the report" as a task, it just became part of how the company runs. Executives started quoting yesterday's numbers before coffee. Ops stopped firefighting. And marketing stopped guessing.
The report wasn't just on time, it was alive.
Steal This Workflow (Please 🥺)
If your mornings still involve spreadsheets, apologies, or "quick syncs," this is your way out.
Create five nodes: Time to Query to Text Gen to Graphs to Mail.
Point it at your data. Give it a day.
Then watch your 9:00 AM turn into clarity instead of chaos.
Startups to enterprises use WorqHat to automate what they already know needs to happen, from daily reports to dashboards and full workflows.
You don't need more people or code. Just better mornings.


Starting with WorqHat
is Simple, Fast and Free
Join thousands of developers, designers, and creators who use WorqHat to build amazing products. Get early access to new features, tutorials, and updates delivered straight to your inbox.